Neural Stochastic Processes for Satellite Precipitation Refinement
Under Review
Currently, the paper is under review and we will set the links once it is published. For now, our code and a static demo are provided as anonymous supplementary materials.
Abstract
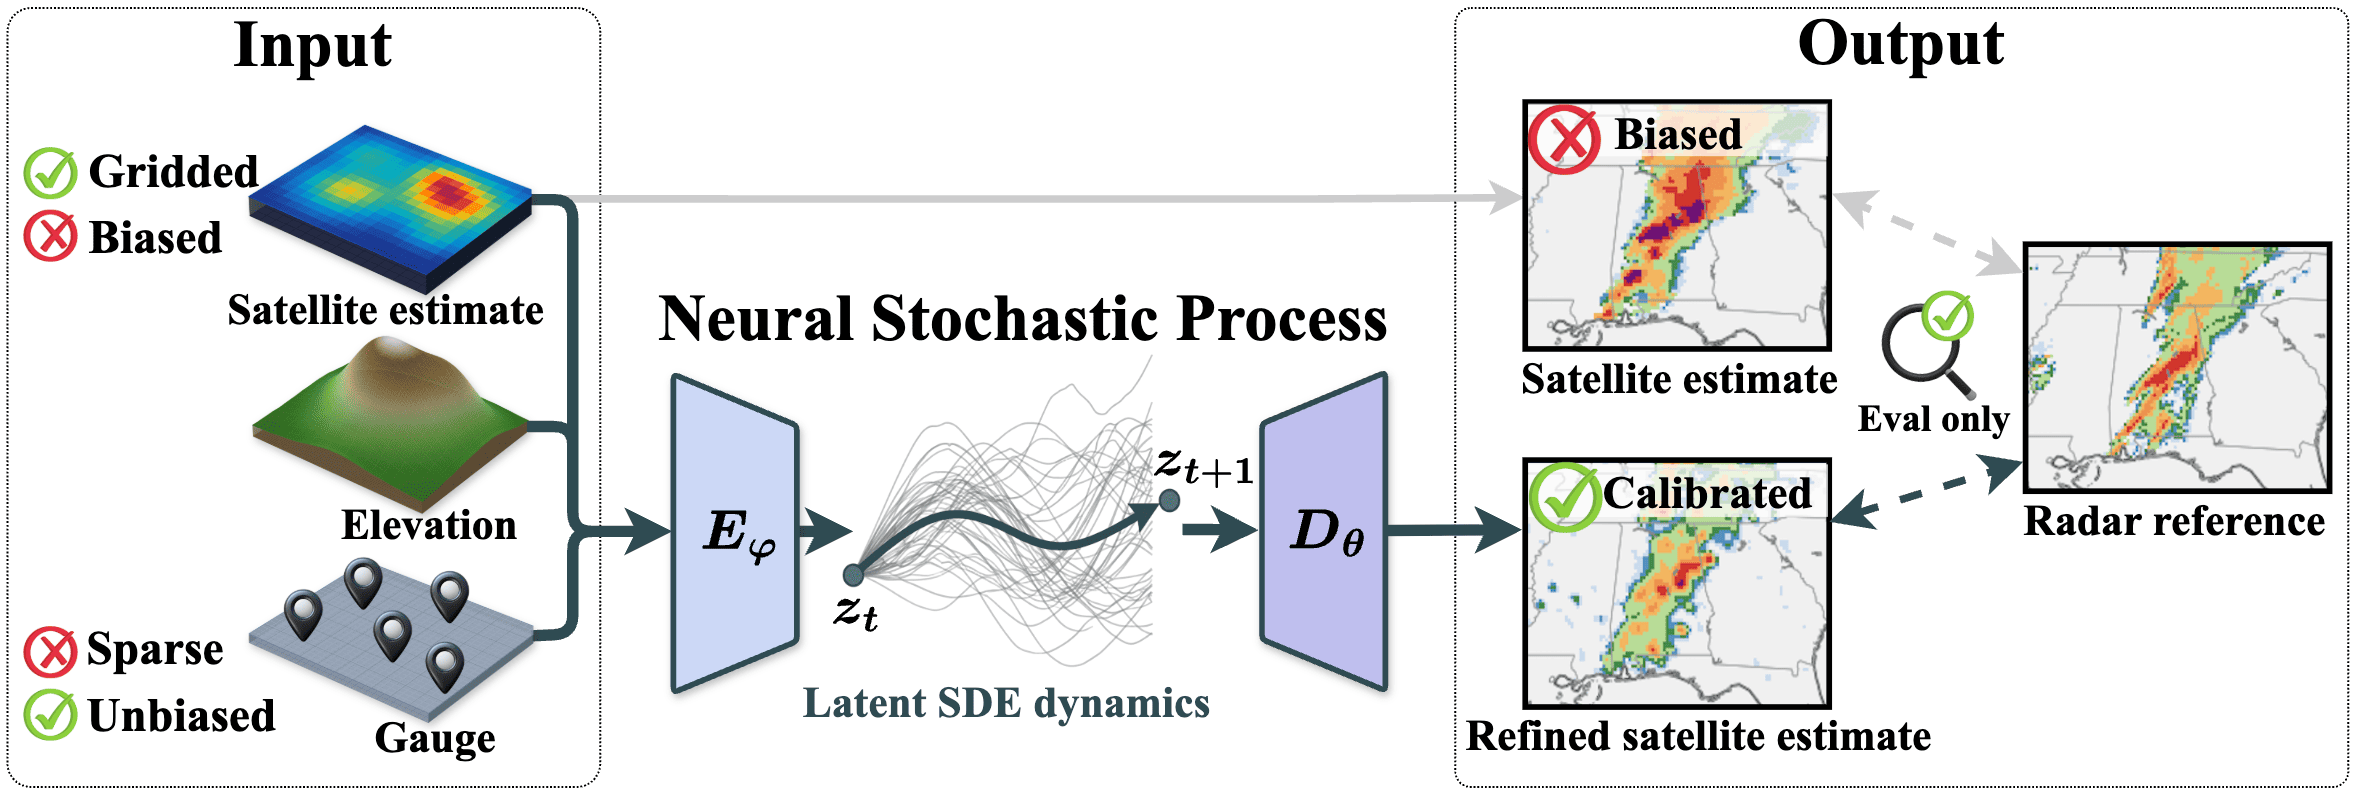
Accurate precipitation estimation is critical for flood forecasting, water resource management, and disaster preparedness. Satellite products provide global hourly coverage but contain systematic biases; ground-based gauges are accurate at point locations but too sparse for direct gridded correction. We propose Neural Stochastic Process (NSP), pairing a set-conditioned spatial latent encoder with a Neural SDE transition regularizer to improve spatial refinement with single-hour inference. An Euler-discretized variational model yields an analytic conditional transition KL, used in a regularized training objective without simulating SDE trajectories. We also introduce QPEBench, a benchmark of 43,756 hourly samples over the Contiguous United States (2021–2025), with four aligned data sources and six deterministic metrics. Compared with 17 baselines, NSP achieves the best performance across all six deterministic metrics and surpasses JAXA's operational gauge-calibrated product. NSP also transfers to two regions excluded from training without parameter updates, using sparse local gauges. Controlled experiments show benefits from temporal coupling during training and learned latent transitions during temporary gauge outages.
Overview
-
Sparse-context encoder
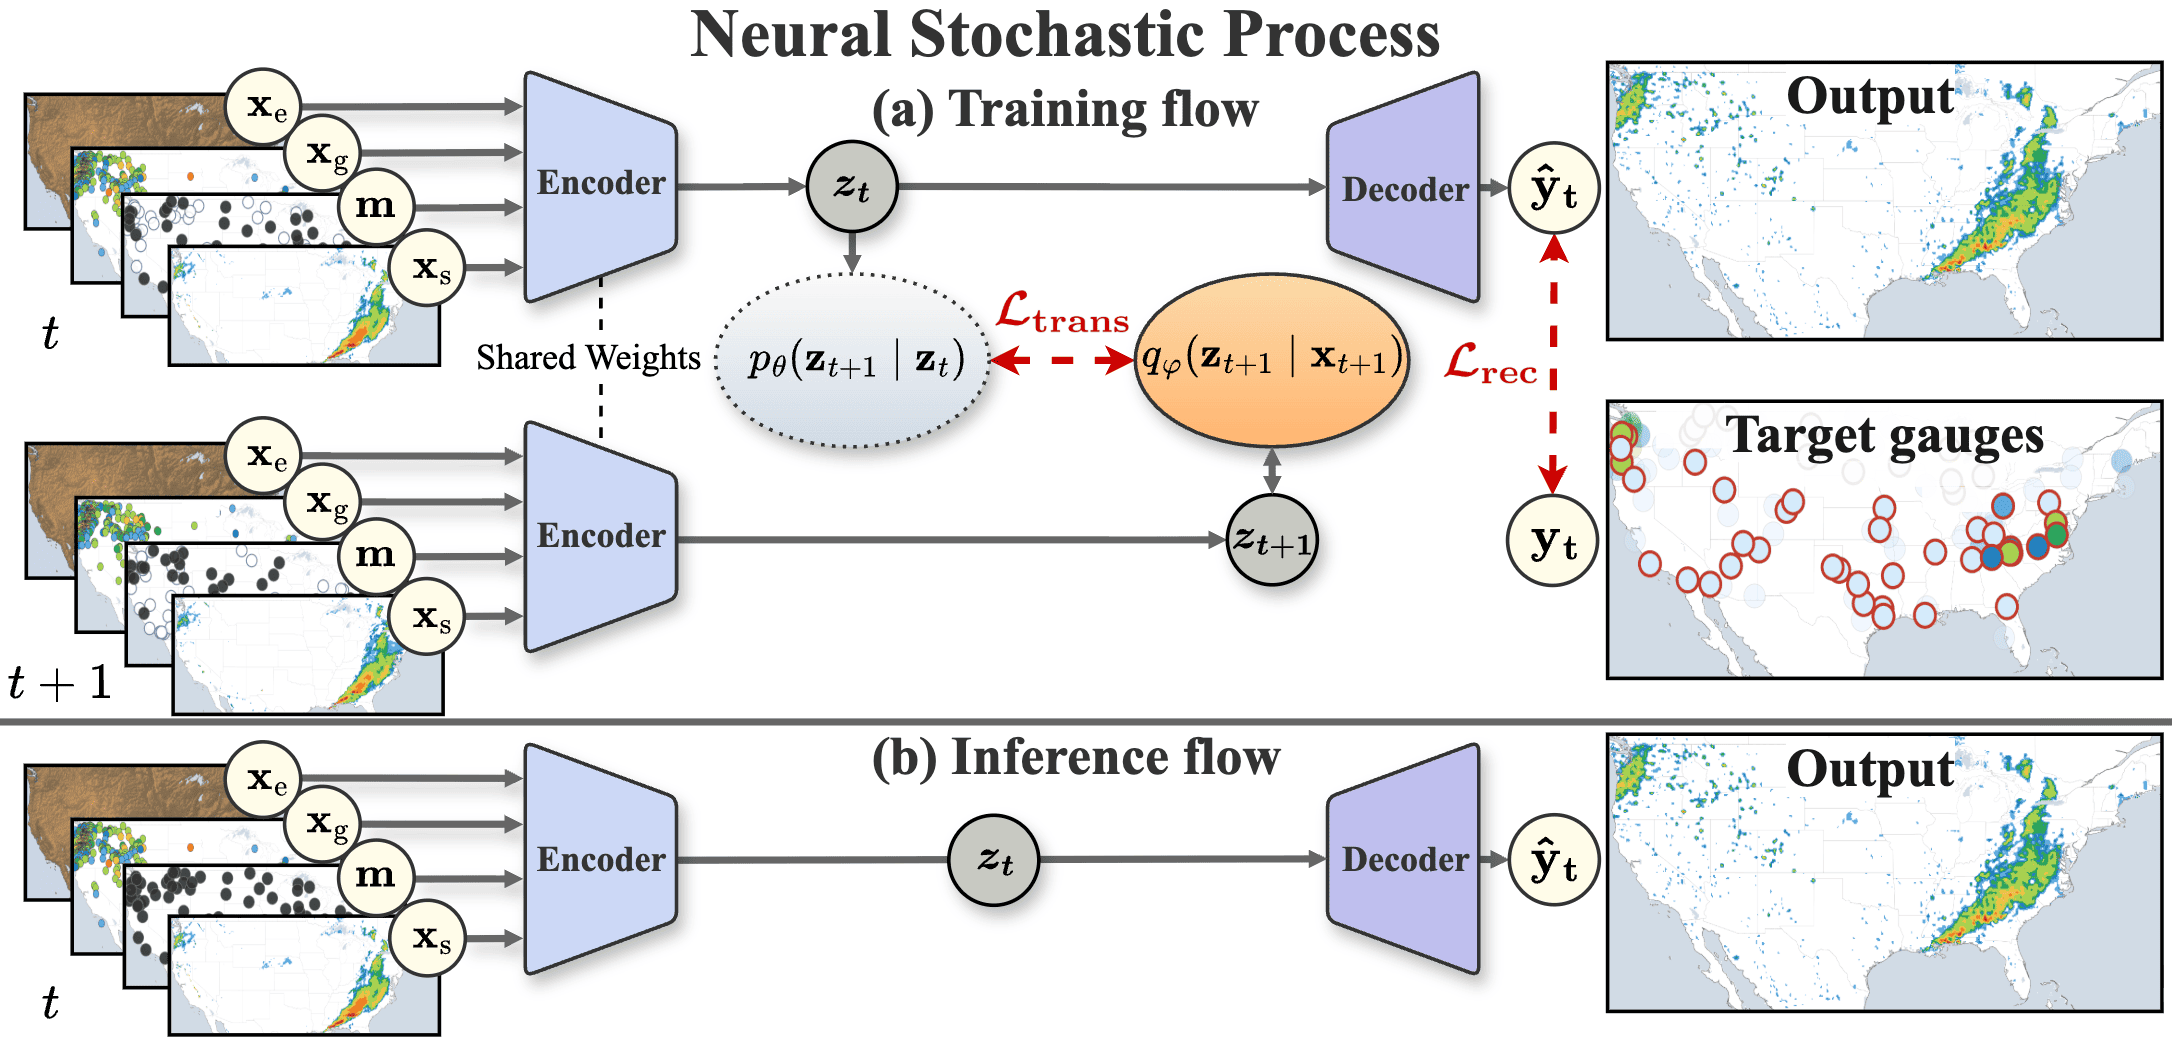
For each hour, the encoder ingests the satellite estimate, elevation, and an arbitrary, time-varying set of gauge observations encoded as a sparse map and a binary mask. It outputs a spatially structured Gaussian posterior over a 2D latent field, enabling a single model to accommodate the irregular gauge network without architectural changes.
-
Latent Neural SDE prior
A convolutional Neural SDE defines the latent prior transition. Training uses a Gaussian transition KL from an Euler–Maruyama discretization. Its conditional value is analytic, with a latent sample for the remaining expectation and no trajectory simulation during training. Default hourly inference bypasses the SDE; a separate gauge-outage study evaluates latent rollout.
-
Residual decoder
The decoder predicts a residual correction in log-precipitation space and a heteroscedastic predictive variance, conditioned on the latent field, the satellite estimate, and elevation. The refined precipitation field is then obtained by applying the residual on top of the satellite prior.
Benchmark
QPEBench combines four aligned data sources on a common 260×590 grid at 0.1° resolution (~11 km), spanning five years (January 2021 – December 2025). The benchmark covers the contiguous United States with hourly samples and a radar reference excluded from model inputs and reconstruction targets. Dataset quality control removes gauge readings above 20 mm/h when both radar and satellite are below 1 mm/h; radar therefore participates in this preprocessing rule.
-
Satellite (GSMaP MVK)
JAXA’s GSMaP MVK product provides the gauge-uncorrected hourly satellite precipitation estimate. We chose GSMaP over IMERG because the MVK and gauge-calibrated GC variants share the same retrieval algorithm, enabling a controlled comparison of gauge fusion methods under the same satellite baseline.
-
Elevation (ETOPO 2022)
Elevation is taken from ETOPO 2022 and resampled to the common 0.1° grid. It is concatenated with the satellite and gauge inputs at every time step.
-
Gauge observations (Synoptic Data API)
Hourly reports from 11,879 unique stations are obtained through the Synoptic Data API, totalling more than 423 million records. After quality filtering, an average of 7,269 gauges per hour are retained.
-
Radar reference (NOAA MRMS)
NOAA’s Multi-Radar Multi-Sensor (MRMS) Radar-Only QPE provides spatially dense radar estimates without direct gauge adjustment. Models receive satellite, elevation, and gauge inputs; radar supplies the areal evaluation reference and the gauge-spike quality-control check described above.
Results
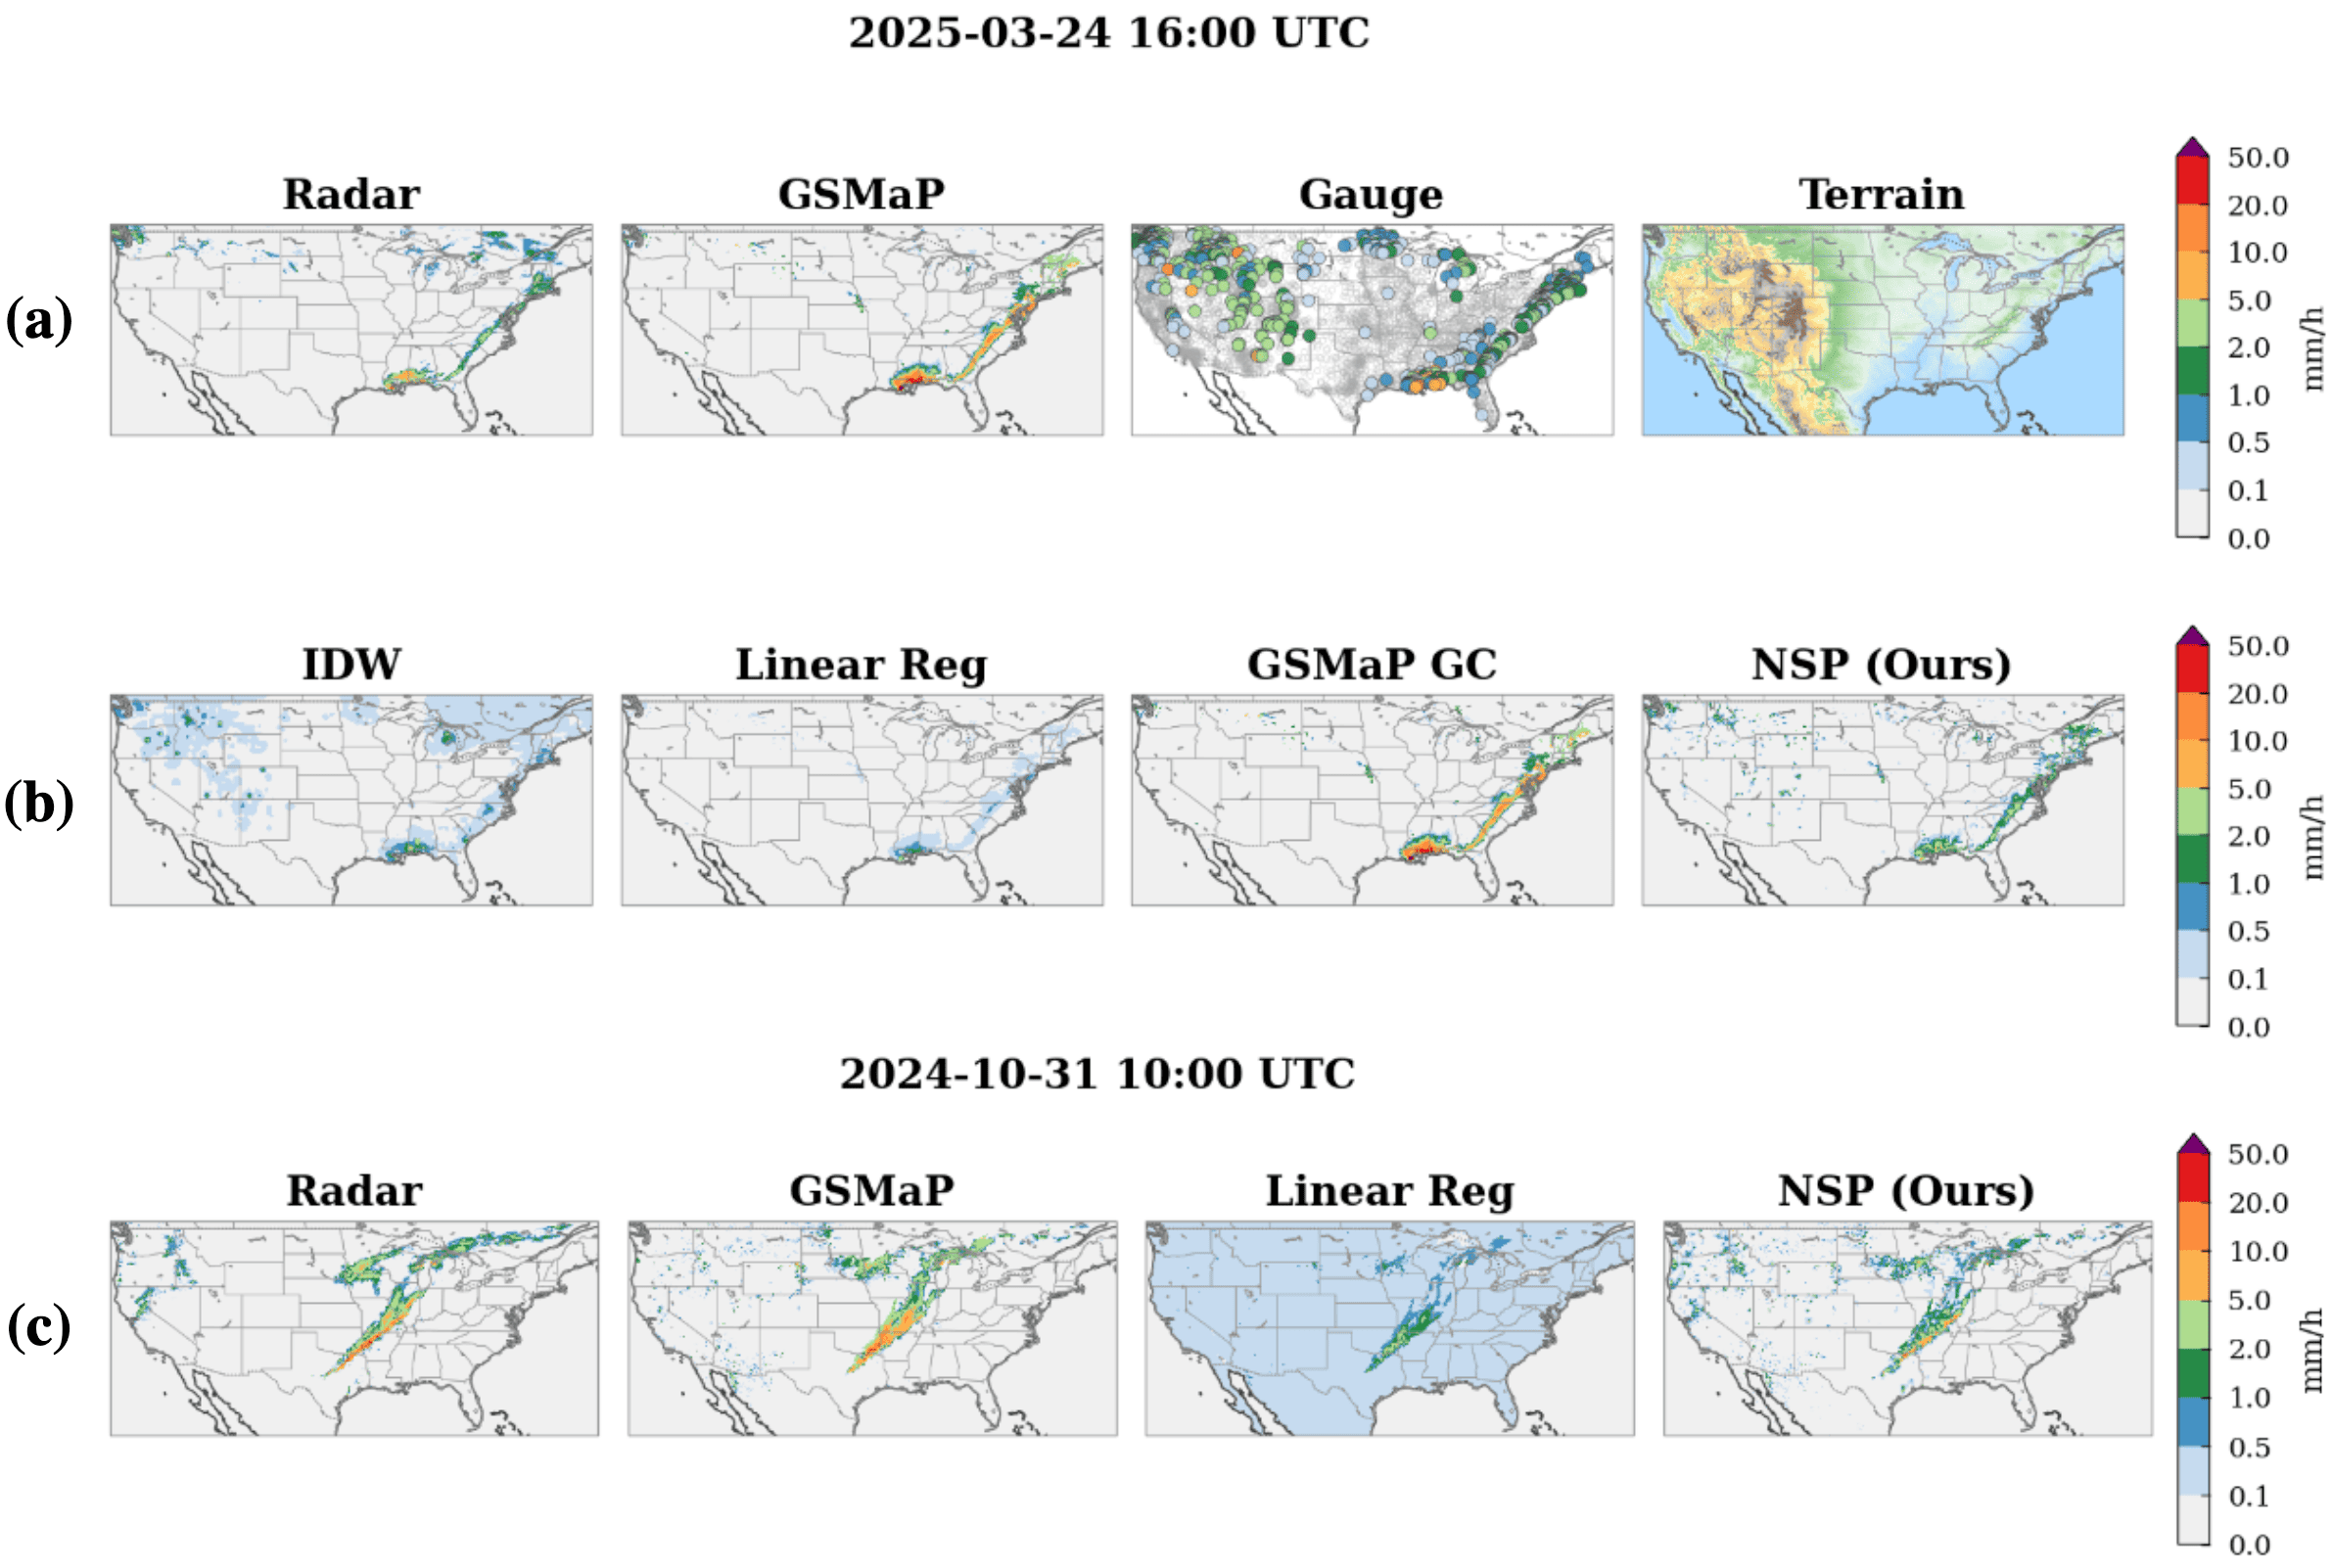
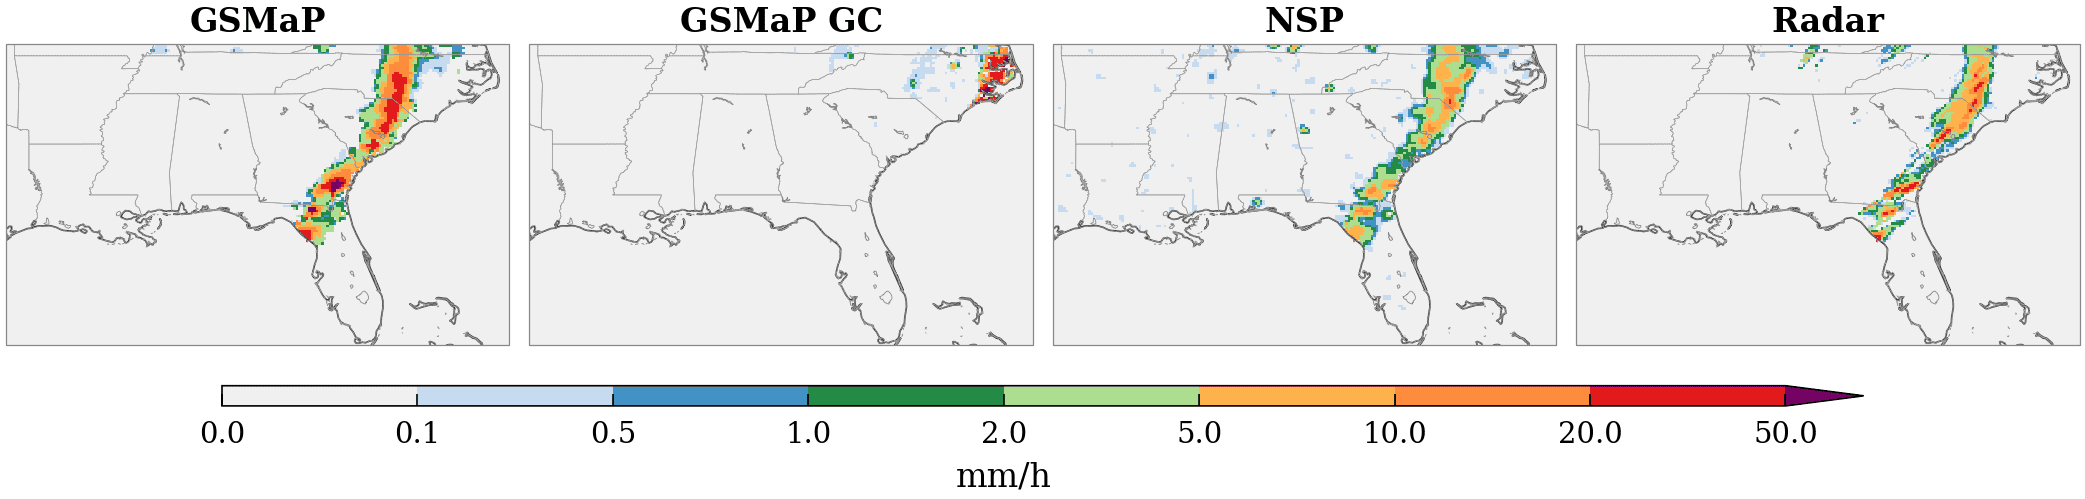
Table 1 compares NSP with 17 baselines and the operational GSMaP GC reference. Mean ± standard deviation is reported across the three test years. Best comparable scores are in bold, including ties at the reported precision. NSP reduces rainy-area RMSE by 4.0% relative to LETKF and 4.2% relative to GSMaP GC, while improving FSS over GSMaP GC by 7.6%.
These six deterministic metrics define the core QPEBench comparison. The paper's complementary probabilistic studies evaluate predictive distributions and learned transitions under their own stated sampling and verification protocols.
Table 1. Quantitative comparison on the CONUS test folds.
| Method | RMSEr ↓ | MAEr ↓ | RMSEg ↓ | MAEg ↓ | rr,coll ↑ | FSSR ↑ |
|---|---|---|---|---|---|---|
| Quantile mapping | 4.073 ± 0.184 | 2.012 ± 0.063 | 0.885 ± 0.027 | 0.173 ± 0.006 | 0.288 ± 0.014 | 0.479 ± 0.010 |
| EMOS | 3.885 ± 0.127 | 1.844 ± 0.078 | 1.115 ± 0.096 | 0.179 ± 0.019 | 0.305 ± 0.013 | 0.478 ± 0.029 |
| GWR | 3.739 ± 0.230 | 1.627 ± 0.081 | 0.662 ± 0.021 | 0.155 ± 0.004 | 0.376 ± 0.016 | 0.229 ± 0.017 |
| Cokriging | 3.706 ± 0.121 | 1.789 ± 0.069 | 1.065 ± 0.081 | 0.220 ± 0.015 | 0.279 ± 0.016 | 0.461 ± 0.009 |
| GSMaP | 3.638 ± 0.126 | 1.826 ± 0.076 | 1.017 ± 0.086 | 0.179 ± 0.020 | 0.288 ± 0.014 | 0.483 ± 0.014 |
| SDA | 3.513 ± 0.074 | 1.661 ± 0.037 | 0.588 ± 0.030 | 0.098 ± 0.005 | 0.468 ± 0.019 | 0.470 ± 0.012 |
| RePaint | 3.464 ± 0.099 | 1.683 ± 0.042 | 0.476 ± 0.068† | 0.073 ± 0.010† | 0.467 ± 0.018 | 0.456 ± 0.011 |
| Kriging | 3.204 ± 0.076 | 1.645 ± 0.027 | 0.774 ± 0.022 | 0.177 ± 0.005 | 0.006 ± 0.003 | 0.007 ± 0.002 |
| ConvCNP | 3.135 ± 0.098 | 1.596 ± 0.046 | 0.684 ± 0.018 | 0.100 ± 0.003 | 0.475 ± 0.005 | 0.053 ± 0.011 |
| U-Net | 3.123 ± 0.057 | 1.563 ± 0.038 | 0.666 ± 0.028 | 0.100 ± 0.004 | 0.461 ± 0.021 | 0.064 ± 0.052 |
| XGBoost | 3.121 ± 0.103 | 1.477 ± 0.043 | 0.596 ± 0.033 | 0.102 ± 0.003 | 0.470 ± 0.009 | 0.162 ± 0.016 |
| CNP | 3.115 ± 0.077 | 1.575 ± 0.056 | 0.699 ± 0.033 | 0.116 ± 0.006 | 0.340 ± 0.018 | 0.014 ± 0.011 |
| BP-Net | 3.063 ± 0.064 | 1.508 ± 0.008 | 0.685 ± 0.012 | 0.099 ± 0.002 | 0.443 ± 0.030 | 0.088 ± 0.002 |
| ViT | 3.059 ± 0.108 | 1.530 ± 0.079 | 0.687 ± 0.022 | 0.116 ± 0.016 | 0.411 ± 0.003 | 0.118 ± 0.019 |
| IDW | 2.987 ± 0.070 | 1.474 ± 0.020 | 0.645 ± 0.018 | 0.145 ± 0.004 | 0.352 ± 0.010 | 0.157 ± 0.002 |
| Linear regression | 2.967 ± 0.064 | 1.457 ± 0.020 | 0.709 ± 0.019 | 0.170 ± 0.005 | 0.299 ± 0.017 | 0.189 ± 0.012 |
| LETKF | 2.937 ± 0.006 | 1.444 ± 0.010‡ | 0.715 ± 0.021 | 0.223 ± 0.004 | 0.406 ± 0.022 | 0.375 ± 0.009 |
| GSMaP GC | 2.942 ± 0.085 | 1.473 ± 0.039 | 0.737 ± 0.039 | 0.147 ± 0.007 | 0.375 ± 0.022 | 0.490 ± 0.023 |
| NSP (Ours) | 2.818 ± 0.062 | 1.444 ± 0.026‡ | 0.393 ± 0.047 | 0.076 ± 0.013 | 0.478 ± 0.021 | 0.527 ± 0.022 |
Radar errors use valid land pixels with radar precipitation above 0.1 mm/h. Gauge errors include context cells unless marked. Batch-level scores are averaged within each year, then across three years.
† RePaint's gauge errors exclude copied context cells. On this held-out subset, NSP has RMSEg = 0.369 and MAEg = 0.070. ‡ LETKF and NSP tie in MAEr at three decimals; the paired hourly test favors NSP (p ≤ 10−4).
Qualitative Results
Interactive Demo
The static demo lets reviewers browse May 2025 CONUS snapshots at hourly cadence. The archived demo shows model inputs and outputs from the earlier experiment bundle; its snapshot scores are separate from the three-fold comparison above: GSMaP MVK, ETOPO 2022 elevation, the NSP refined field, and the MRMS radar reference. The gauge channel that the model also consumes is not shown or shipped — the Synoptic Data API terms of service prohibit redistribution of the underlying station readings.
BibTeX
@misc{anon2027nsp,
  title  = {Neural Stochastic Processes for Satellite Precipitation Refinement},
  author = {Anonymous},
  note   = {Under review},
  year   = {2027}
}
A final citation entry will be released once review is complete.